Calls for Service
Annual report information about Albuquerque Police calls for service.
Albuquerque Relies on APD
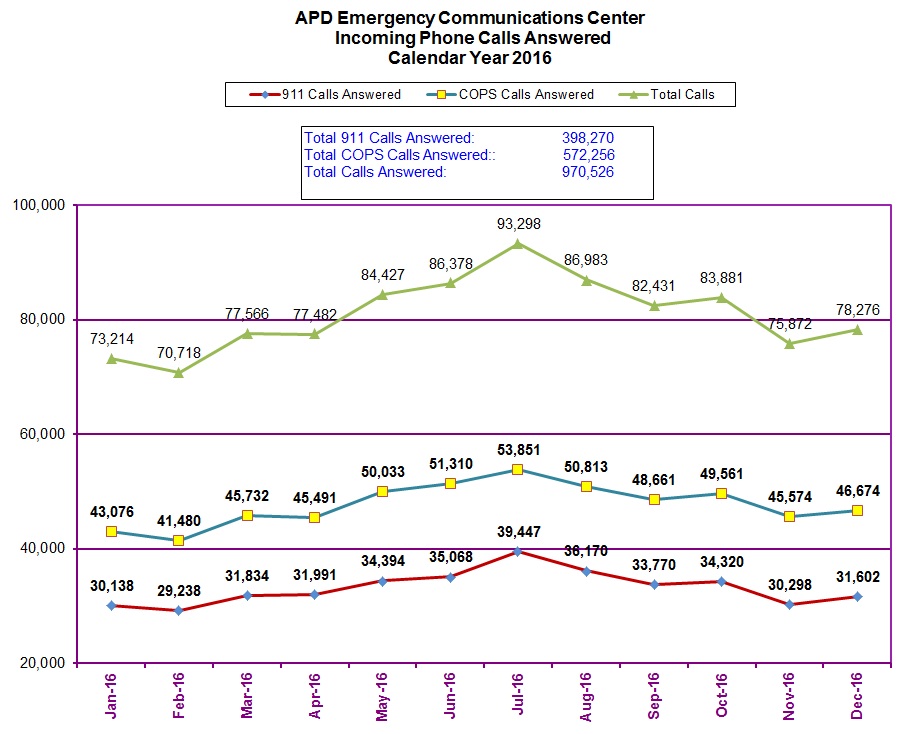
Chart: APD Emergency Communications Center - Telephone Calls Answered
Figures for Calendar Year 2016.

Table: APD Emergency Communications Center - Telephone Calls Answered Jan-June
Figures for Calendar Year 2016.
| Month | 911 – Percentage Answered within 10 Seconds | 911 Calls Answered | 242-COPS – Percentage Answered within 30 Seconds | 242-COPS Calls Answered | Total Calls |
|---|---|---|---|---|---|
| Jan 2016 | 88.78% | 30,138 | 92.76% | 43,076 | 73,214 |
| Feb 2016 | 88.36% | 29,238 | 92.29% | 41,480 | 70,718 |
| Mar 2016 | 85.72% | 31,834 | 90.41% | 45,732 | 77,566 |
| Apr 2016 | 83.09% | 31,991 | 88.93% | 45,491 | 77,482 |
| May 2016 | 89.44% | 34,394 | 76.79% | 50,033 | 84,427 |
| Jun 2016 | 88.81% | 35,068 | 78.98% | 51,310 | 86,378 |
Goal for Jan. 1, 2016 to June 30, 2016:
- 9-1-1 Calls: 92 percent of calls answered within 10 seconds
- 242-COPS: 90 percent of calls answered within 30 seconds
Table: APD Emergency Communications Center - Telephone Calls Answered July-Dec.
| Month | 911 – Percentage Answered within 10 Seconds | 911 Calls Answered | 242-COPS – Percentage Answered within 90 Seconds | 242-COPS Calls Answered | Total Calls |
|---|---|---|---|---|---|
| Jul 2016 | 89.95% | 39,447 | 92.13% | 53,851 | 93,298 |
| Aug 2016 | 86.93% | 36,170 | 90.55% | 50,813 | 86,983 |
| Sep 2016 | 87.09% | 33,770 | 87.44% | 48,661 | 82,431 |
| Oct 2016 | 88.23% | 34,320 | 88.58% | 49,561 | 83,881 |
| Nov 2016 | 92.33% | 30,298 | 91.89% | 45,574 | 75,872 |
| Dec 2016 | 89.79% | 31,602 | 87.00% | 46,674 | 78,276 |
Current goal effective July 1, 2016:
- 911 Calls: 92 percent of calls answered within 10 seconds
- 242-COPS: 90 percent of calls answered within 90 seconds
Calendar Year Averages & Totals
- 911 % Answered within 10 Seconds : 88.21 percent
- 911 Calls Answered : 398,270
- 242-COPS % Answered within 30 Seconds : 87.99 percent
- 242-COPS Calls Answered : 572,256
- Total Calls : 970,526
Types of Calls

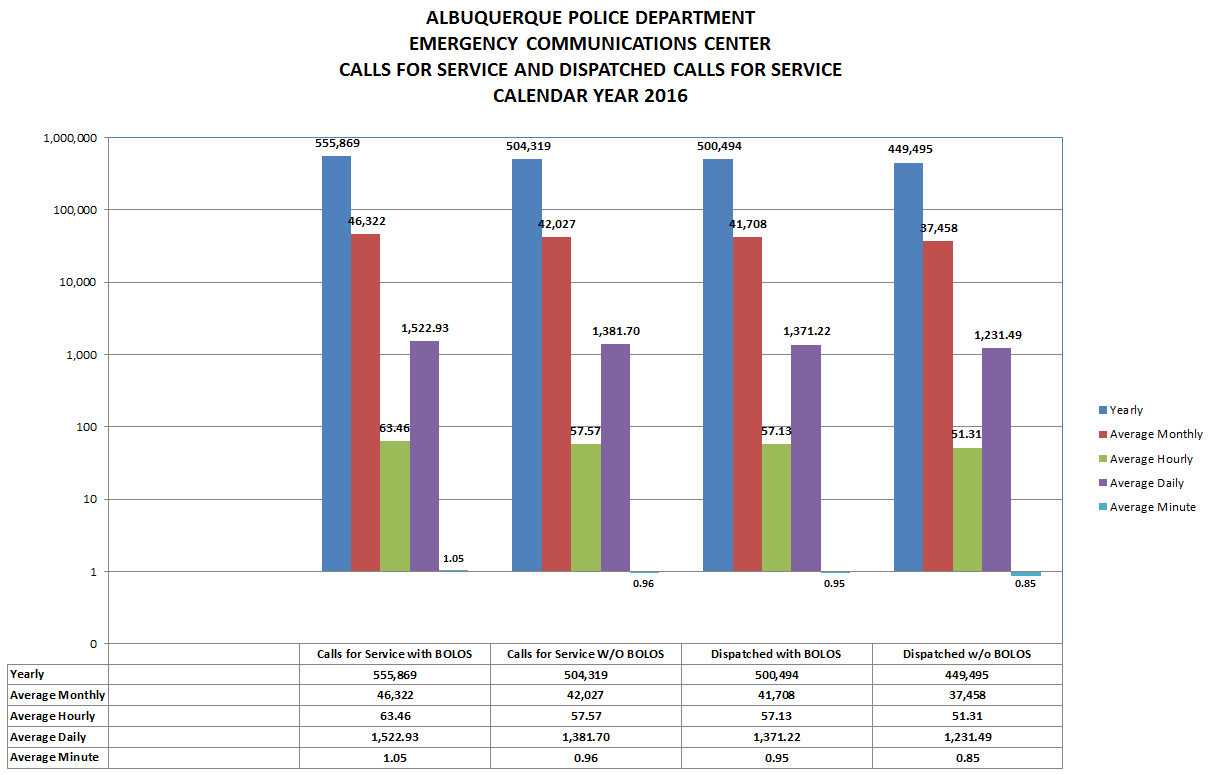
Chart: Calls for Service

Table: Calls for Service
| Time Period | Calls for Service with BOLOS | Calls for Service W/O BOLOS | Dispatched with BOLOS | Dispatched w/o BOLOS |
|---|---|---|---|---|
| Yearly | 555,869 | 504,319 | 500,494 | 449,495 |
| Average Monthly | 46,322 | 42,027 | 41,708 | 37,458 |
| Average Hourly | 63.46 | 57.57 | 57.13 | 51.31 |
| Average Daily | 1,522.93 | 1,381.70 | 1,371.22 | 1,231.49 |
| Average Minute | 1.05 | 0.96 | 0.95 | 0.85 |
Calls for Service: Definitions
- CAD(s) - Computer Aided Dispatch (system)- computer documentation of an incident generated as a result of a call.
- BOLO(s) - Be on the lookout (advisory status).
- CADS - Calls For Service - Events generated from a phone call which may result in an officer being dispatched to the scene, or calls which require an advisory status (such as a BOLO) be entered. For example we enter a call for service for a BOLO, however, in the majority of instances, an officer is not physically dispatched. It is a method to quickly advise officers of information they need to be aware of (advisory status).
- Dispatched Calls For Service - Calls which actually result in an officer being dispatched to a scene as a result of a call included subject stops and traffic stops. May include duplicate events (several people reporting the same incident).
