Air Quality Trends

The Air Quality Program provides information on regional air quality trends over time.

View current air quality trend data from the EPA.

View City of Albuquerque statistics from the EPA.

View City of Albuquerque air quality design values from the EPA.

Ozone in the Southwest

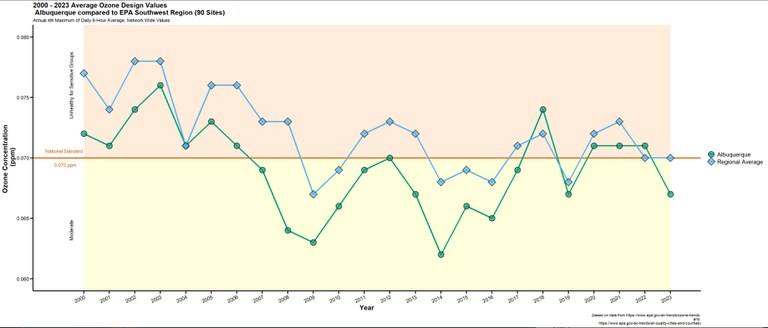
A line graph showing Average Ozone Design Values in Albuquerque compared to EPA Southwest Region (90 sites). The national standard is 0.070 ppm. Albuquerque and the regional average fluctuate above and below this standard but Albuquerque stays below this more often.

Ozone levels in Albuquerque remain below the regional average.

Download Data

Carbon Monoxide in the Southwest

A line graph showing Average Carbon Monoxide Design Values in Albuquerque compared to EPA Southwest Region (16 sites). The national standard is 9 ppm. Albuquerque and the regional average are below this in the "Good" zone for the entire time.

Carbon Monoxide levels in Albuquerque remain below the regional average.
Download Data

PM10 in the Southwest

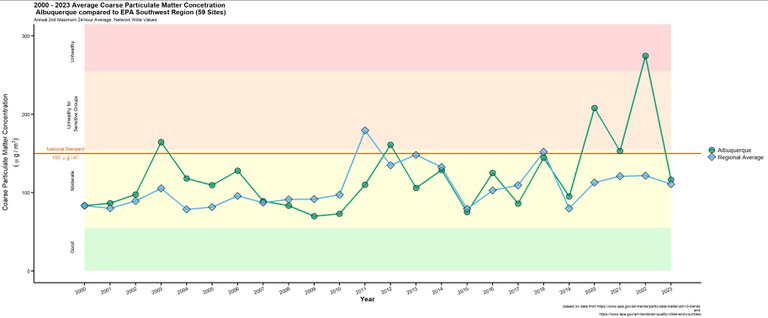
A line graph showing Average Particulate Matter Concentration in Albuquerque compared to EPA Southwest Region (59 sites). The national standard is 150. Albuquerque and the regional average stay below this most of the time but Albuquerque spikes above in 2012, 2020, and 2022.

Particulate Matter (PM10) levels in Albuquerque slightly exceed the regional average.

Download Data

PM2.5 in the Southwest

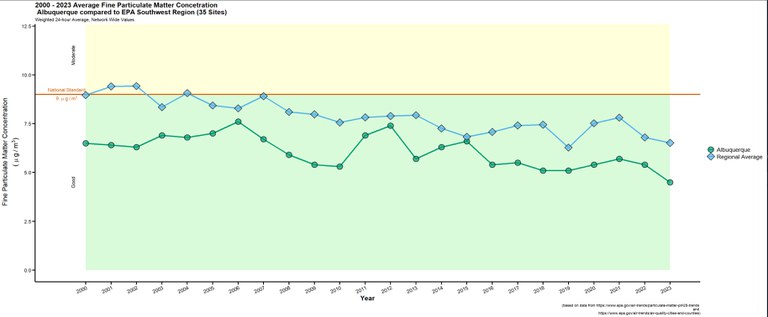
A line graph showing Average Fine Particulate Matter Concentration Values in Albuquerque compared to EPA Southwest Region (35 sites). The national standard is 9. Albuquerque is below this standard the whole time, the regional standard stars slightly above it then drops below in 2003.

Particulate Matter (PM2.5) levels in Albuquerque slightly exceed the regional average.

Download Data

Sulfur Dioxide in the Southwest

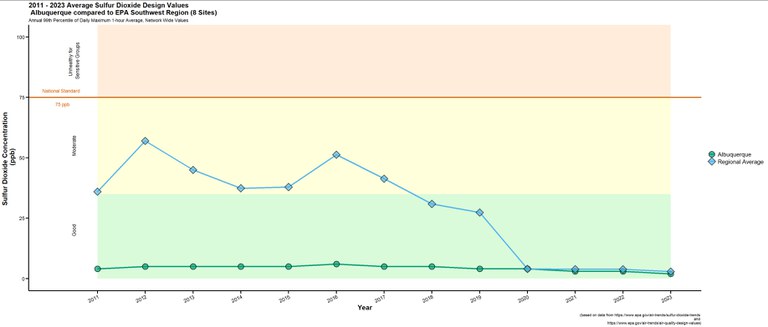
A line graph showing Average Sulfur Dioxide Design Values in Albuquerque compared to EPA Southwest Region (8 sites). The national standard is 75 ppb. Albuquerque and the regional average stay below this standard with Albuquerque staying in the "good" zone the entire time.

Sulfur Dioxide levels in Albuquerque remain below the regional average.

Download Data

Nitrogen Dioxide in the Southwest

A line graph showing Average Nitrogen Dioxide Design Values in Albuquerque compared to EPA Southwest Region (17 sites). The national standard is 100 ppb. Albuquerque and the regional average stay this standard the entire time, going into the good zone in 2009.

Nitrogen Dioxide levels in Albuquerque remain below the regional average.
Download Data